
PYQ + trends
1. TITLE
NEET 2024 Q4: Graph Conversion: How to plot a−t graphs from v−t slopes — Full solution + Why they asked this
2. THE ACTUAL NEET QUESTION
NEET 2024 — Question
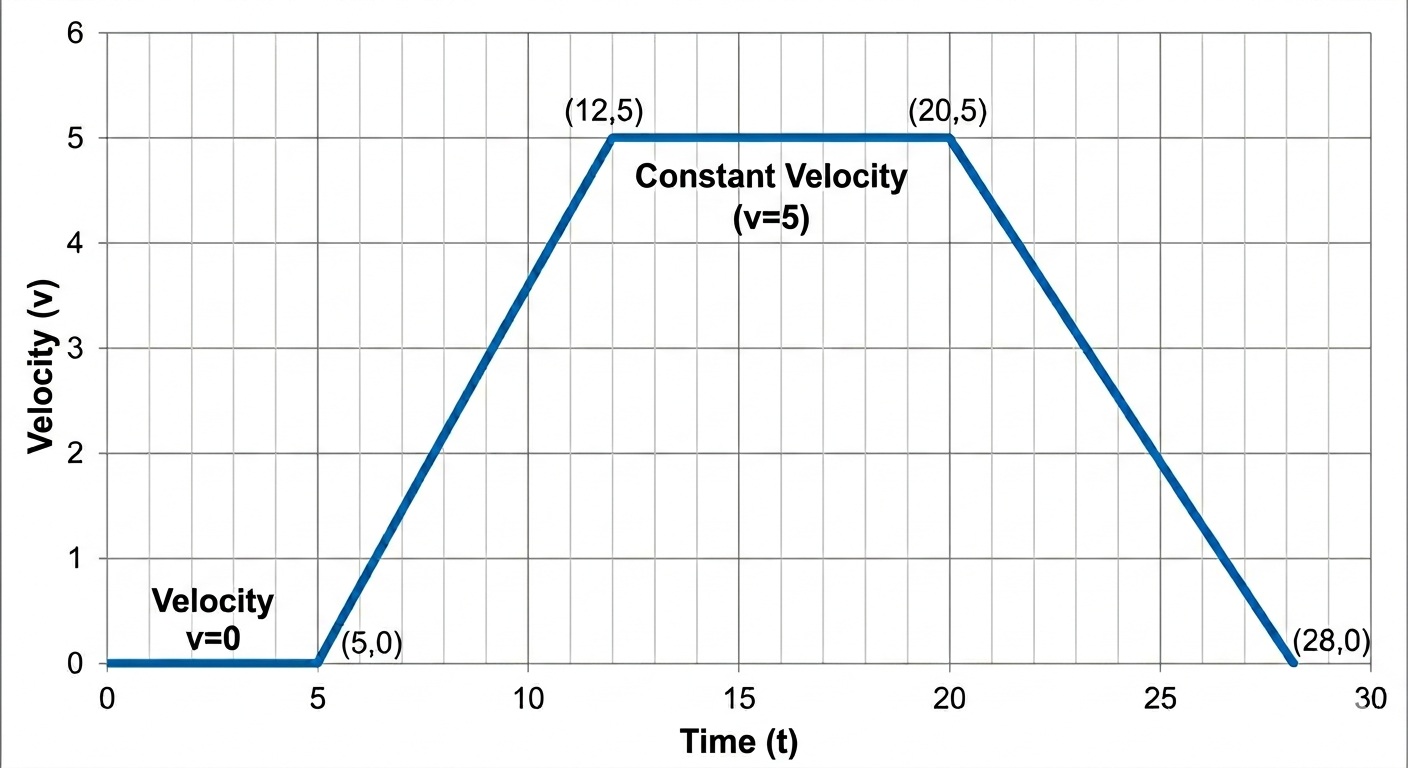
The velocity (v) time (t) plot of the motion of a body is shown below. The acceleration (a) time (t) graph that best suits this motion is:
A) (Shows acceleration continuously increasing)
B) (Shows acceleration matching the velocity curve exactly)
C) (Shows $a=0$, then a constant positive step, then $a=0$, then a constant negative step)
D) (Shows parabolic curves for acceleration)
3. OFFICIAL ANSWER
NEET Answer Key: (Option C)
4. COMPLETE SOLUTION
Step-by-step calculation & Concept Explanation:
To convert a velocity-time ($v-t$) graph into an acceleration-time ($a-t$) graph, we must use the fundamental principle of kinematics: Instantaneous acceleration ($a$) is the slope of the tangent to the velocity-time ($v-t$) curve at that specific instant ($a = \frac{dv}{dt}$).
Let's break the given $v-t$ graph into 4 distinct phases:
1. Initial Phase (Flat on t-axis): The body has zero velocity ($v=0$) and the slope is zero. Therefore, acceleration $a = 0$.
2. Second Phase (Rising straight line): The velocity increases at a constant rate. A straight line inclined to the time axis has a constant positive slope. Therefore, acceleration is a constant positive value (a flat horizontal line above the time axis).
3. Third Phase (Flat horizontal line above t-axis): The velocity is constant ($v = \text{max}$). The slope of a horizontal line is zero. Therefore, acceleration drops back to zero ($a = 0$).
4. Final Phase (Falling straight line): The velocity decreases back to zero uniformly. The slope is constant and negative. Therefore, acceleration is a constant negative value (a flat horizontal line below the time axis).
Matching this with the options, Option C perfectly represents these steps: $0 \rightarrow \text{+ve constant} \rightarrow 0 \rightarrow \text{-ve constant}$.
5. WHY NEET ASKED THIS
Explain the examiner's intent:
* What concept were they testing? The examiner wanted to test if students mathematically connect acceleration to the slope of a $v-t$ graph, rather than the shape of the $v-t$ graph.
* What's the common mistake they expected students to make? Students often assume that if velocity is increasing, acceleration must also be increasing (choosing graphs where $a$ rises diagonally). They fail to realize that a steady increase in velocity means a constant acceleration.
* Which option was the "trap"? The option mirroring the shape of the $v-t$ graph (Option B) is a classic trap. Students visually match shapes without applying the calculus concept ($a = \frac{dv}{dt}$).
6. TREND ANALYSIS
| Year | How they asked | Twist |
| 2024 | Convert v−t graph to a−t graph. | Testing stepwise slope changes (0, +ve, 0, -ve). |
| 2022 | Identify the x−t graph for positive acceleration. | Shifting from v−t to x−t. Required knowing that positive acceleration yields an upward-opening parabola. |
| 2022 | Ratio of velocities from an x−t graph with angles $30^\circ$ and $45^\circ$. | Combining graph slopes with trigonometry ($\frac{\tan 30^\circ}{\tan 45^\circ}$). |
Prediction for NEET 2025/2026:
Expect the reverse variation! You might be given an $a-t$ graph and asked to identify the corresponding $v-t$ or $x-t$ graph. Alternatively, they could ask for displacement by calculating the area under a $v-t$ curve (using the area of trapeziums or triangles).
7. SIMILAR QUESTIONS TO PRACTICE
"If you understood this, you can solve:"
* NEET 2022 Q10: Ratio of velocities from displacement-time graphs making angles $30^\circ$ and $45^\circ$.
* NEET 2022 (Re) Q11: Finding the position-time ($x-t$) graph for positive acceleration.
* Area/Displacement variation: Finding displacement from the bounded area of a $v-t$ graph.
8. QUICK REVISION FOR THIS TYPE
For Graph Conversion questions, always:
* First check: The axes! Are you looking at $x-t$, $v-t$, or $a-t$? Reading the wrong axis is the #1 silly mistake.
* Then apply: The golden rules of Kinematics Graphs:
1. Slope of $x-t$ graph = Velocity ($v$).
2. Slope of $v-t$ graph = Acceleration ($a$).
3. Area under $v-t$ graph = Displacement ($\Delta x$).
* Watch out for: Horizontal lines! A horizontal $v-t$ line means $a=0$. A horizontal $x-t$ line means $v=0$.
9. NCERT BASE
This question tests: NCERT Class 11, Physics Chapter: Motion in a Straight Line. specifically the section on "Kinematic Equations for Uniformly Accelerated Motion" and graphical representations of acceleration (Sections covering $v-t$ and $a-t$ curves).
10. CTA
All PYQs from this chapter → Kinematics Guide
Practice similar questions → Mock exams